INTRODUCTION
Surface water ponds are valuable habitats; they offer essential services to all lives on Earth, although accounting for just 3% of the planet’s surface (Downing et al., 2006). Western Rajasthan is a region of the Thar Desert that experiences unpredictable rainfall and has an average daily requirement of 10 litres per person, with an additional 20 litres recommended for livestock (Hanlon, 2017). Our ancestors had known the importance of water for life, and several surface water conservation strategies have been constructed as rain-fed Nadis and Talab. According to a preliminary study, 42.4 per cent of potable water in villages in western Rajasthan has relied on Nadi, 34.7 per cent on Tanka, 15.0 per cent on wells and tube-wells, as well as 7.8 per cent on other supplies (Narain, Khan & Singh, 2005). There were 14,36,592 and 1,822 Nadis surveyed by the Central Arid Zone Research Institute (CAZRI) in Nagaur, Barmer and Jaisalmer, respectively. Nadis fulfils about 13% of the total demand for water in Nagaur district and 37.06% of total water demand in three districts. These reservoirs do not retain water throughout the year. Some of them become empty in critical summer. Human interference has deteriorated the natural quality of some of surface water reservoirs, and for this reason, these freshwater ponds are under pressure. Information on hydrology in the field, basin, region and state levels is scarce and, in many cases, unreliable in Rajasthan, specifically in the western area. Attempts must be made to create appropriate hydrological and water resource models for water management and utilization.
Horton developed the Water Quality Index (WQI) in 1965 as a method of computing all the physicochemical and biological aspects of water into a single number that would represent the water’s quality. There are twenty-one distinct WQI models identified in which mostly WQI models are analyzed in river systems (Uddin, Nash & Olbert, 2021). Pond water maybe categorized for its appropriateness for different applications based on the results of WQI (Chapman, 1996). The community has extensively used several of the water quality index methodologies for water quality assessments (Said, Stevens & Sehlke, 2004). US National Sanitation Foundation Water Quality Index, NSFWQI (Brown et al., 1972), Canadian Water Quality Index (CCME, 2001), British Columbia Water Quality Index, BCWQI (Zandbergen & Hall, 1998), Oregon Water Quality Index, OWQI (Cude, 2001) and the Florida Stream Water Quality Index, FWQI (SAFE, 1995) are very frequently used water quality indices in various parts of the world. It calculates the combined impact of several water quality variables and estimates surface and groundwater supplies for appropriate use by authorities and communities on a regular basis.
There is a need for more understanding of water quality standards in western Rajasthan since the rainy season is short and rainfall is sporadic in the region. Unsafe fluoride levels in the district’s groundwater have been identified in Nagaur through several investigations. In India, several recent studies revealed surface and groundwater quality by using water quality indices (Adimalla & Qian, 2019), (Karunanidhi et al., 2021), Adimalla, (2020). But no previous records of WQI were found on these semi-arid significant water resources.
STUDY AREA
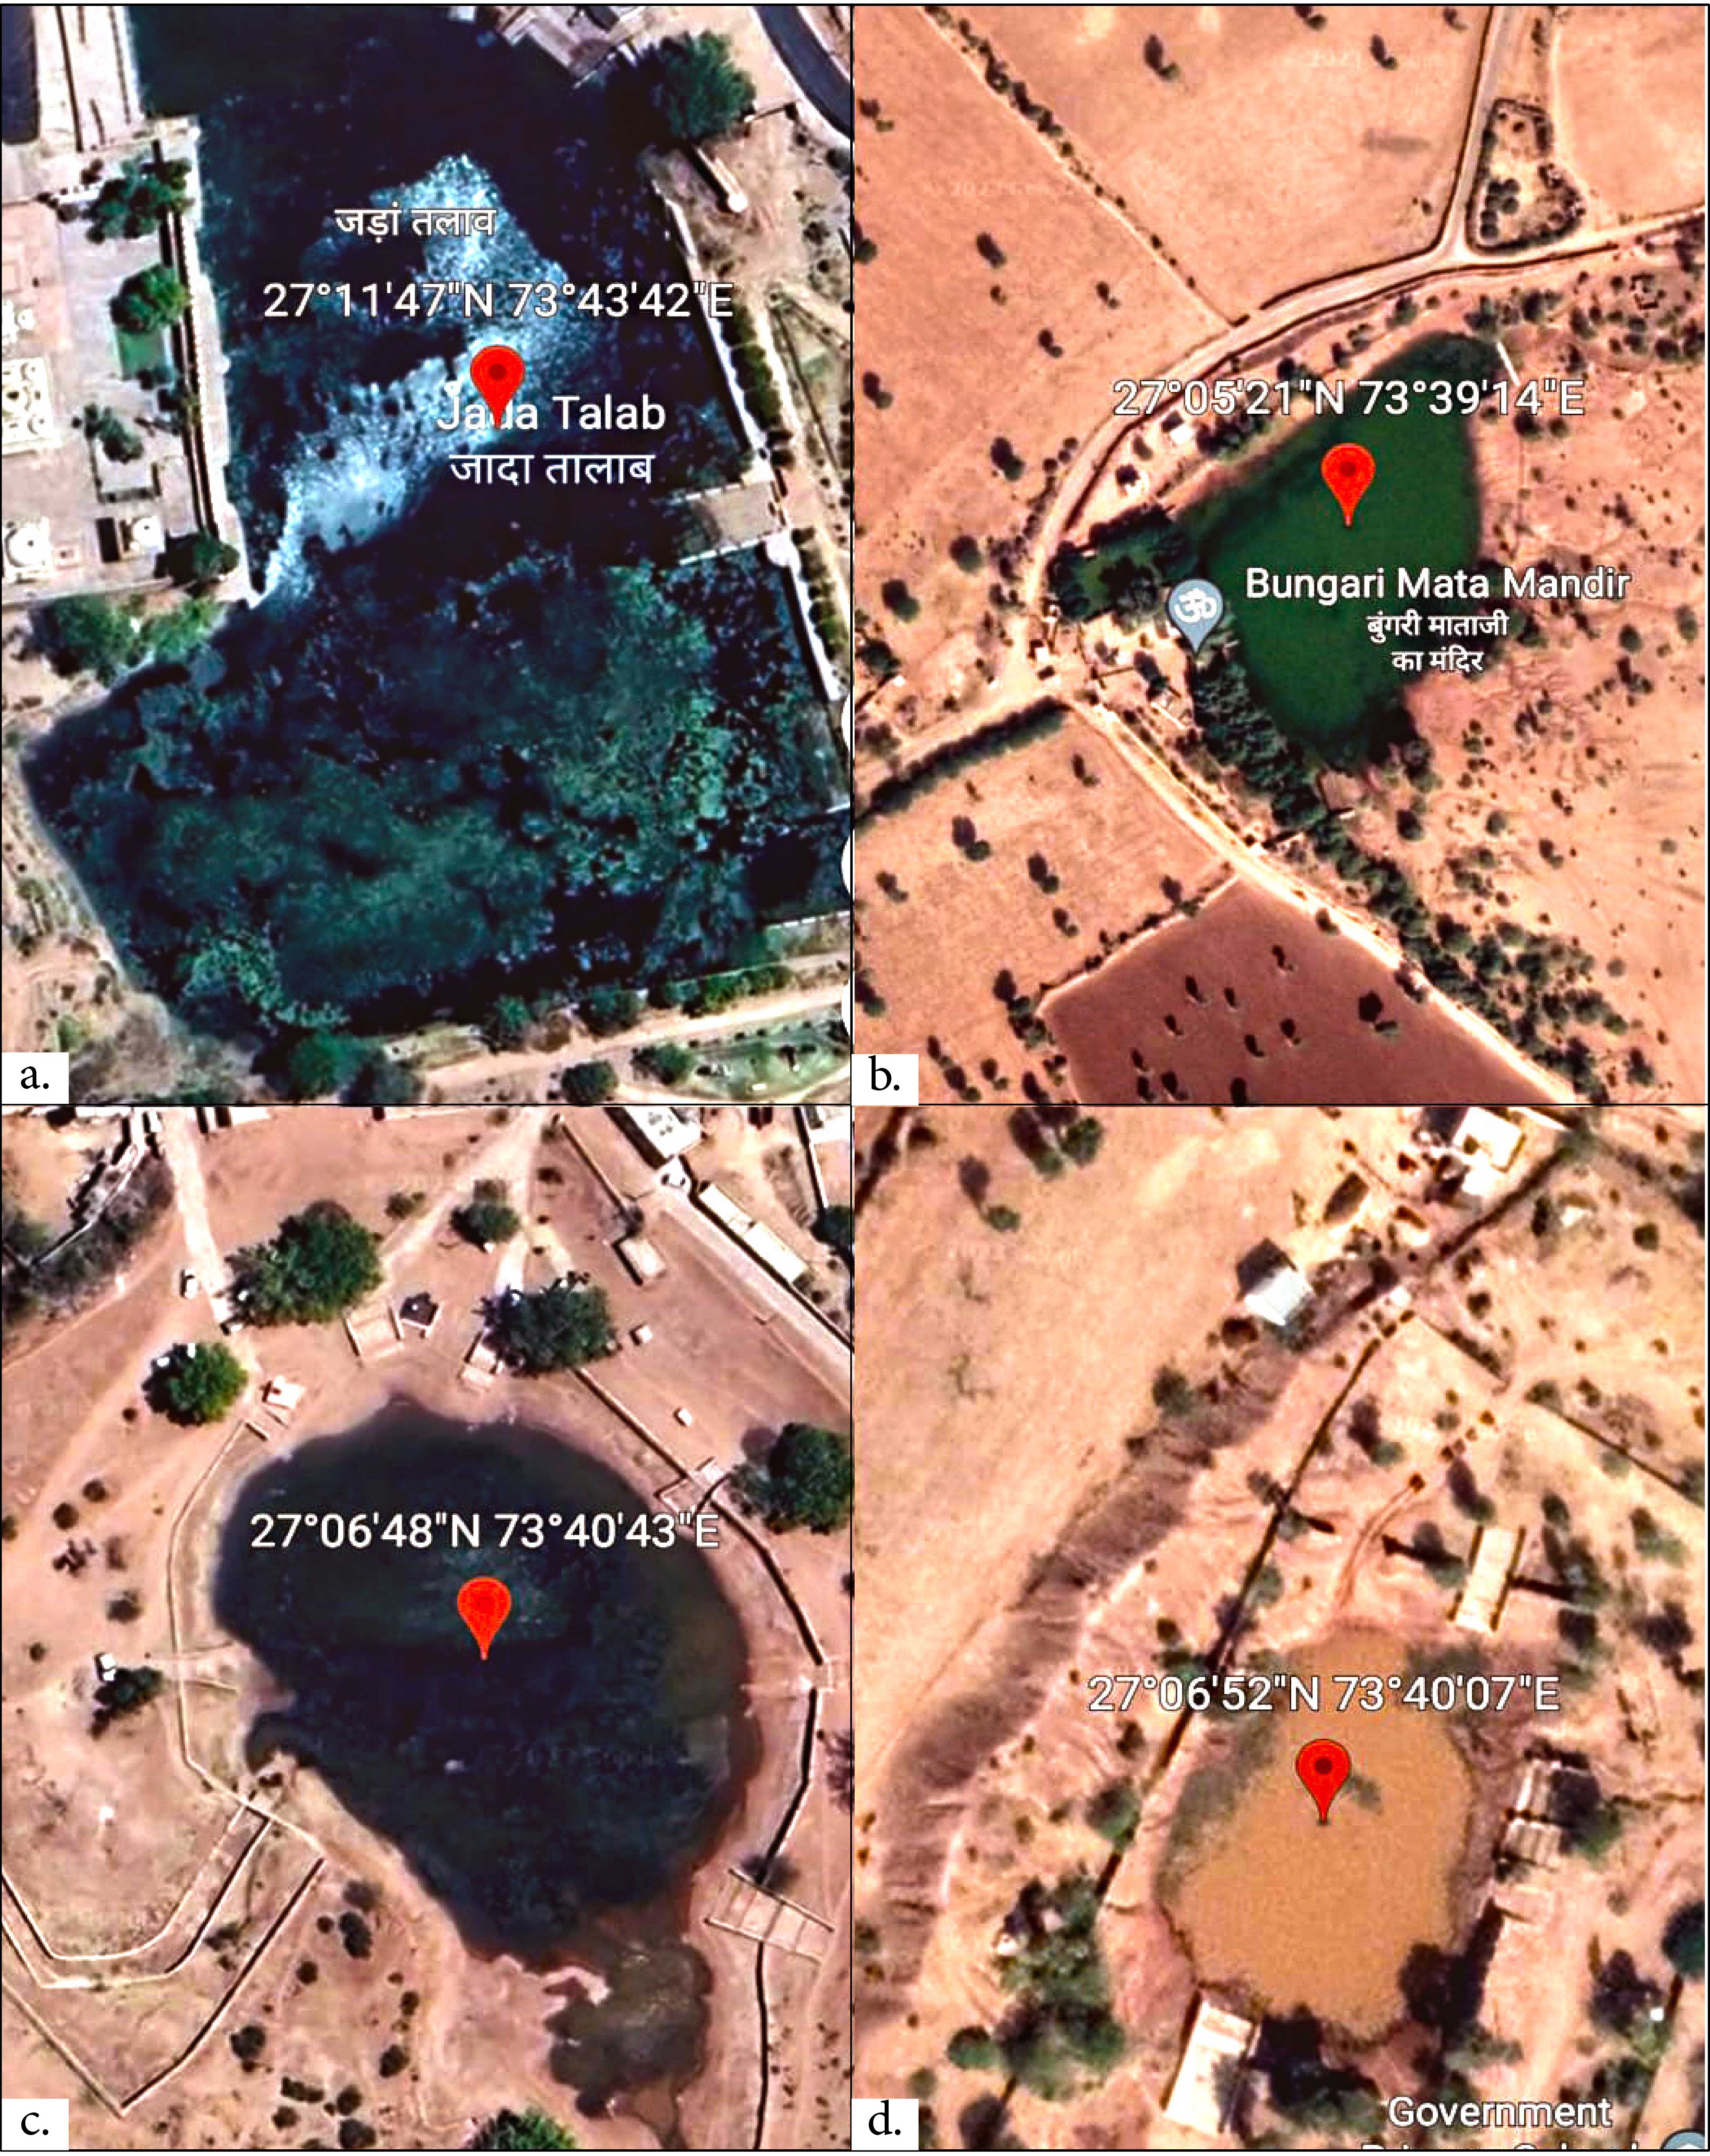
All four-water reservoirs, under study, were situated in the Nagaur district, which lies between North latitudes 26°25’-27°40’ and East longitudes 73°10’-75°15’. It falls under the semi-arid Thar Desert and is characterized by thorny vegetation, frequent drought conditions with high concentration of nitrate and phosphorus in groundwater. Small ponds in the village are being used for consumption for both humans and livestock. During the monsoon period, the nadis and talab basin receive fresh water and are often built in conformity with existing topography, which acts as a natural catchment. In dune regions, nadis ranged in depth from 4 meters, with substantial seepage loss, smaller catchments, and lesser run-off. The first sampling site is the historical Jada Talab located in Nagaur city. The other three sampling sites are small ponds managed by the village communities and called Bungari Mata Mandir Talab (sampling site-2), Chimrani Nadi (sampling site-3), Imarti Nadi (sampling sites-4) after their village/locality name.

Figure 1. Surface reservoirs selected in the study: (a.) Jada Talab; (b.) Bungari Mata Mandir Talab; (c.) Chimrani Nadi; (d.) Imarti Nadi.
METHODOLOGY
Physico-chemical parameter analysis
The observations were made from July, 2020 to June, 2021 from selected sampling site once in a month. Water samples were collected in 1000 ml plastic bottles that were thoroughly washed and dried before sample collection. After sample collection, proper labelling was done. With the help of a global positioning system (GPS) as shown in Fig. 1, the sampling locations were marked. The physico-chemical parameter such as pH, TDS, Fluoride, Nitrate, Chloride, Total Alkalinity, Total Hardness, biological oxygen demand (BOD) and dissolved oxygen (DO) were determined by following analytic standard procedures of the American Public Health Association. HANNA Hi 98,129 multimeter was used to measure the parameters in-situ, including pH, water temperature and total dissolved solids. Eriochrome Black T was used as an indicator while a titrant Ethylene Diamine Tetra Acectic acid (EDTA) was used to measure the total hardness in a buffer solution of ammonium chloride and ammonium hydroxide. Titrimetry was employed to measure alkalinity and methyl orange was used as an indicator. The reference solution contained 0.01 M of HCl. Complexometric titration was used to measure the concentrations of calcium, magnesium, and chlorine. Phenol disulphonic acid was used in a spectro-photometric technique to detect nitrate. Based on the idea that the presence of oxygen causes the divalent manganese in the testing sample to oxidize to its high valency, which happens as a brown hydrated oxide with the addition of KI and NaOH, Winkler’s method was used to determine the amount of dissolved oxygen. Fluoride ion concentrations and acceptable water standards are electrometrically quantified in water samples using the ion-specific electrode (ISE). According to standard operating procedures, standard solutions were used to pre-calibrate every instrument utilized for every analysis in order to ensure the accuracy and precision of observations. All of the electrodes were thoroughly cleaned with double-distilled water before each in-situ observation. Before each use, the probes should be conditioned in the sample for the best stabilization time. For the calibration of the rinsed and dry pH probes, freshly prepared buffer solutions of two different units were applied.
The Water Quality Index
The Water Quality Index is a 100-point scale that summarizes data from nine separate measurements and converts water quality into simple phrases (excellent, good, bad, extremely poor and inappropriate in Table 2). WQI might be an effective machine or tool for comparing the water quality of different sources of aquatic bodies’ index is extremely useful and crucial in relating the trend of water quality data with water quality monitoring. In present study, the data matrix was obtained from various seasons (summer, monsoon, post-monsoon and winter), to investigate the spatial and temporal variation in water quality and classify the pond water status (Table 1).
Table 1. Unit Weight (Wi) of different parameters and their standards used for WQI determination
|
|
BIS Standard Sn
|
Wn = K/Sn
|
|
pH
|
8.5
|
0.073489485
|
|
TDS
|
500
|
0.001249321
|
|
Total Alkalinity (mg/l)
|
200
|
0.003123303
|
|
Total Hardness (mg/l)
|
300
|
0.002082202
|
|
Calcium (mg/l)
|
75
|
0.008328808
|
|
Magnesium (mg/l)
|
30
|
0.020822021
|
|
Chloride (mg/l)
|
250
|
0.002498642
|
|
Fluoride( mg/l)
|
1
|
0.624660621
|
|
Nitrate(mg/l)
|
45
|
0.013881347
|
|
DO
|
5
|
0.124932124
|
|
BOD
|
5
|
0.124932124
|
Table 2. Water Quality Rating as per Weighted Arithmetic Water Quality Index Method. (Source: Brown et al., 1972)
|
Water Quality Index
|
Water Quality Status
|
|
0-5
|
Excellent
|
|
26-50
|
Good
|
|
51-75
|
Poor
|
|
76-100
|
Very Poor
|
|
>100
|
Unfit for Consumption
|
Table 3. Various parameters in all seasons at four sites of Nagaur District (Rajasthan) duing June, 2020 to July, 2021
|
Parameters
|
Jada Talab
|
Bungari Mata Mandir Talab
|
Chmirani Nadi
|
Imarti Nadi
|
|
Rainy
|
Winter
|
Summer
|
Rainy
|
Winter
|
Summer
|
Rainy
|
Winter
|
Summer
|
Rainy
|
Winter
|
Summer
|
|
Water Temp. (oC)
|
23.3
|
13.1
|
22.25
|
23.3
|
15
|
22.2
|
23.3
|
13.3
|
21.25
|
23.3
|
13.9
|
21.55
|
|
pH
|
8.57
|
8.25
|
7.93
|
8.21
|
9.06
|
8.17
|
8.4
|
9.01
|
8.55
|
7.67
|
8.54
|
8.86
|
|
TDS
|
974
|
119
|
1362
|
81.5
|
96.2
|
144
|
89.25
|
107
|
198.2
|
85
|
110
|
293.2
|
|
Total Alkalinity (mg/l)
|
172.25
|
202
|
198.5
|
32.5
|
38.7
|
62.5
|
31.25
|
37.5
|
72.5
|
33
|
45.2
|
125
|
|
Total Hardness (mg/l)
|
327.5
|
492
|
435
|
25
|
37.5
|
57.5
|
30
|
40
|
55
|
21.2
|
32.5
|
46.5
|
|
Calcium (mg/l)
|
70
|
83.2
|
123.5
|
10
|
15
|
30
|
10
|
20
|
30
|
10.5
|
14.2
|
20.5
|
|
Magnesium (mg/l)
|
38.7
|
67
|
142.7
|
10
|
20
|
35
|
20
|
20
|
27.5
|
10.7
|
18.2
|
25.75
|
|
Chloride (mg/l)
|
306.25
|
383
|
435.25
|
22.5
|
27.5
|
35
|
32.5
|
40
|
50
|
22.5
|
37.5
|
65
|
|
Fluoride ( mg/l)
|
0.82
|
1.05
|
1.38
|
0.16
|
0.13
|
0.18
|
0.1
|
0.12
|
0.21
|
0.22
|
0.21
|
0.62
|
|
Nitrate (mg/l)
|
13.58
|
51
|
73.5
|
0.84
|
4.58
|
8.17
|
3.97
|
4.58
|
12
|
4.31
|
5.88
|
24.5
|
|
DO
|
6.90
|
9.10
|
5.10
|
8.10
|
9.85
|
6.80
|
8.30
|
9.10
|
8.00
|
8.40
|
9.20
|
7.10
|
|
BOD
|
6.0
|
4.0
|
9.0
|
2.9
|
2.0
|
4.0
|
3.0
|
2.0
|
4.0
|
3.0
|
2.0
|
5.0
|
WQI Calculation (Weighted Arithmetic Water Quality Index Method)
Weighted arithmetic water quality index method classified the water quality according to the degree of purity by using the most commonly measured water quality variables. WQI was calculated with the ‘weighted arithmetic index method’ (Brown et al., 1972), using the formula:
∑ Qn Wn/ ∑ Wn
Step 1: Calculated the unit weight (Wn) factors for each parameter by using the formula:
Wn = K/(Sn)
Where:
K = 1/(∑ 1/Sn)
Sn = Standard desirable value of the nth parameters
On summation of all selected parameters unit weight factors, Wn = 1(unit)
Step 2: Calculate the Sub-Index (Qn) value by using the formula:
Qn = Vn/Sn * 100
Vn= Standard desirable value of the nth parameter
Sn = Standard desirable value of the nth parameters
Step 3: Combining Step 1 & Step 2,
WQI is calculated as follows = Wn Qn
Overall WQI= ∑ Qn Wn/ ∑ Wn
Statistical and Graphs are made by Microsoft Excel.

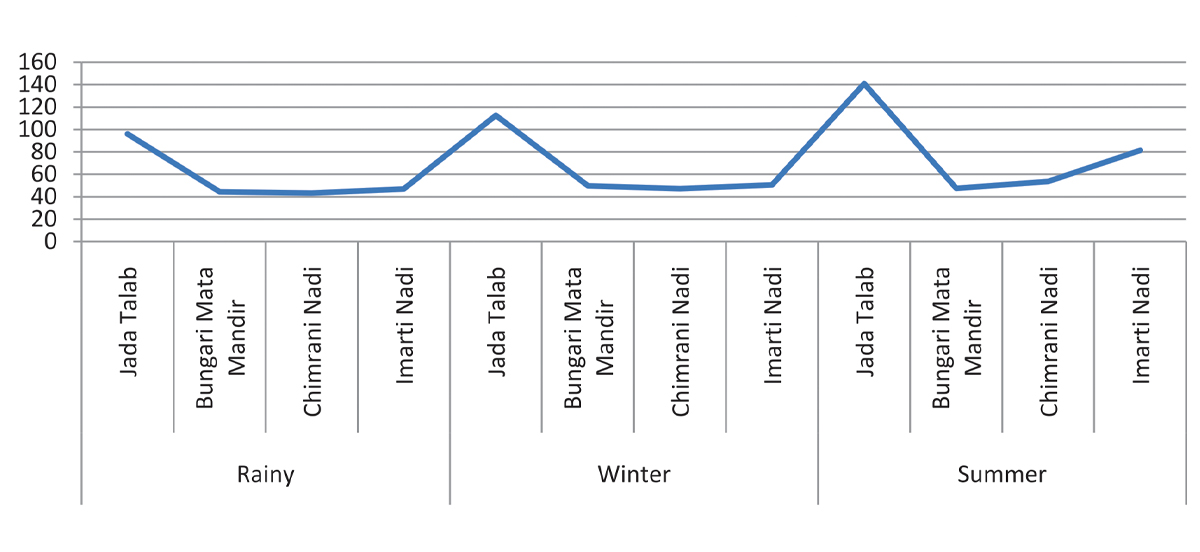
Figure 2. Water Quality Index peaks in sampling sites of western Rajasthan in all seasons during 2020-2021.

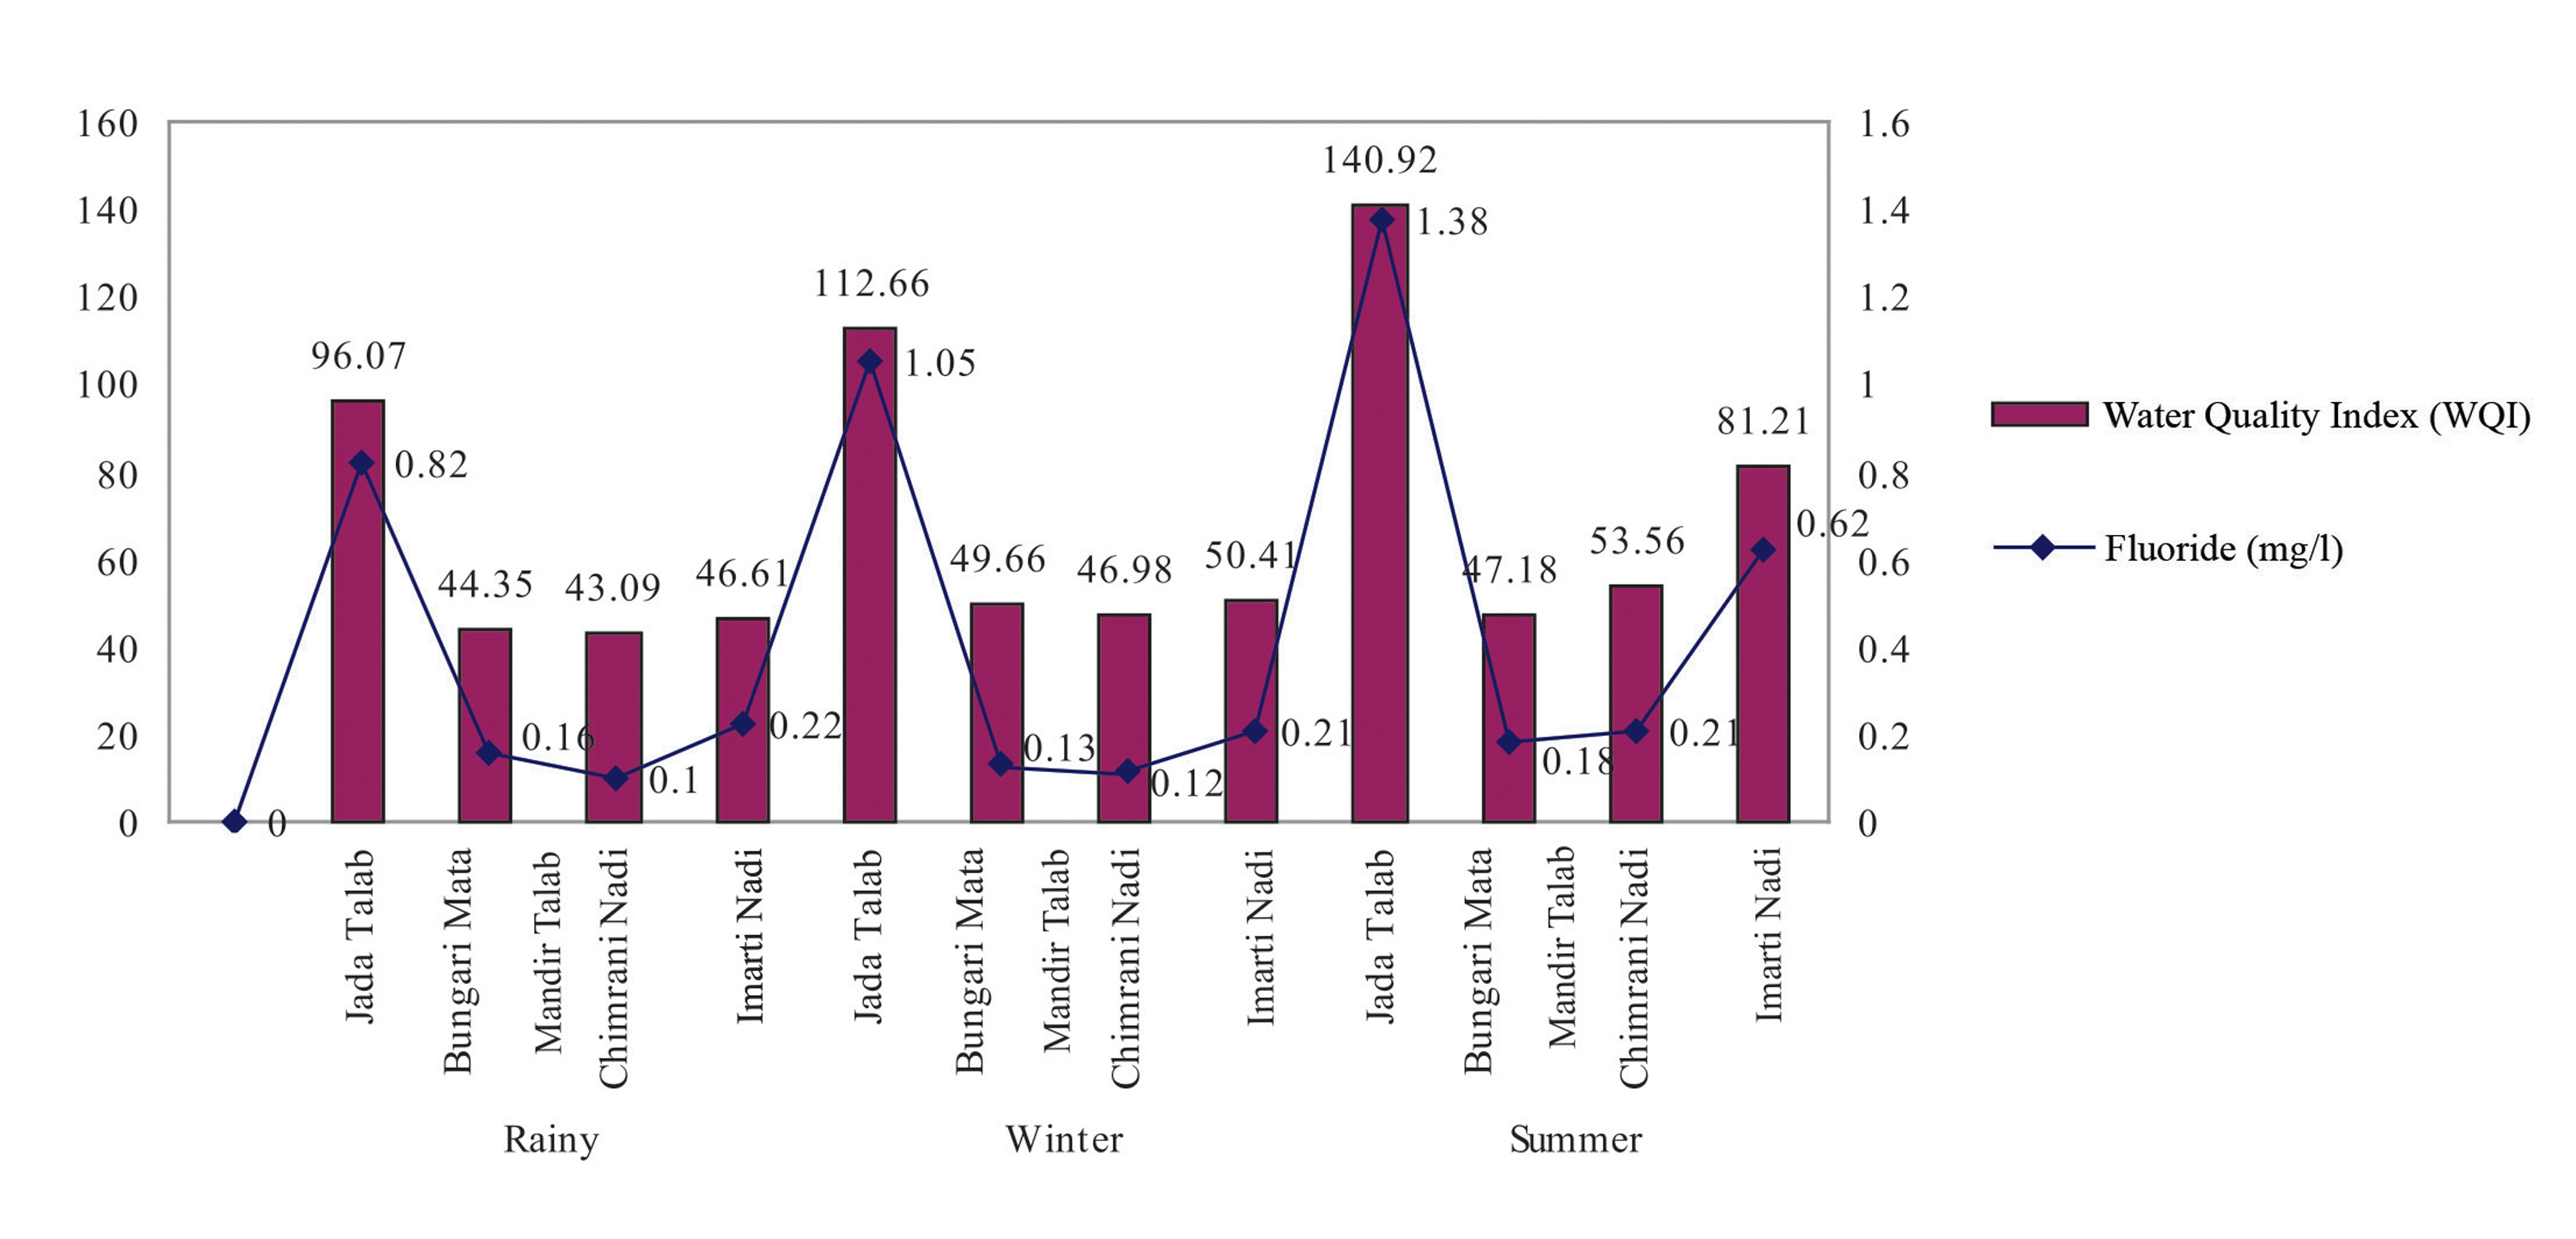
Figure 3. Effect of change in fluoride on Water Quality Index (WQI).
RESULTS AND DISCUSSION
Weighted arithmetic water quality index method was used to assess the water quality status of all four sampling ponds. The tool converts the water quality data into usable information, which express the level of water quality. First of all unit weight for each parameter is estimated to a common scale (Table-1). Standard values of drinking water quality according to BSI are used for the calculation of unit weight. WQI values with physicochemical parameters results of the water samples from all four sampling sites of all seasons are presented in Table 5.
Table 4. Correlation (r) amongst all parameters for all seasons with Water Quality Index (WQI)
|
S. No.
|
Parameters
|
‘r’ value
|
|
1
|
pH
|
0.2335
|
|
2
|
TDS
|
0.7965
|
|
3
|
Total Alkalinity (mg/l)
|
0.9623
|
|
4
|
Total Hardness (mg/l)
|
0.9224
|
|
5
|
Calcium (mg/l)
|
0.9496
|
|
6
|
Magnesium (mg/l)
|
0.891
|
|
7
|
Chloride (mg/l)
|
0.9575
|
|
8
|
Fluoride (mg/l)
|
0.9971
|
|
9
|
Dissolved oxygen(DO)
|
0.0787
|
|
10
|
Biological oxygen demand(BOD)
|
-0.0128
|
Table 5. Summary of Water Quality Index (WQI) of Sampled Sites
|
Season
|
Site
|
Water Quality Index
|
Water Quality Status
|
|
Rainy
|
Jada Talab
|
96.07461579
|
Very Poor
|
|
Bungari Mata Mandir
|
44.34977613
|
Good
|
|
ChimraniNadi
|
43.08634108
|
Good
|
|
ImartiNadi
|
46.61177116
|
Good
|
|
Winter
|
Jada Talab
|
112.6625793
|
Unfit for consumption
|
|
Bungari Mata Mandir
|
49.65603506
|
Good
|
|
ChimraniNadi
|
46.98300594
|
Good
|
|
ImartiNadi
|
50.40797551
|
Poor
|
|
Summer
|
Jada Talab
|
140.9207138
|
Unfit for consumption
|
|
Bungari Mata Mandir
|
47.18429505
|
Good
|
|
ChimraniNadi
|
53.55839253
|
Poor
|
|
ImartiNadi
|
81.21157399
|
Very Poor
|
The highest WQI value (140.92) is reported from sampling site-1 (Jada Talab) in summer whereas the lowest value (43.08) is found in sampling site-3 (Chimrani Nadi) in the rainy season. When analyzing these data seasons wise it is found that the highest WQI was reported in summer season, whereas, in rainy season, WQI value was reported lowest at all sampling sites. WQI reported the highest in sampling site-1 (Jada Talab) and values were observed at 96.07 (rainy), 112.66 (winter) and 140.92 (summer). These values indicated very poor and unsuitable water quality for drinking at this sampling site. On the other hand rest of all sampling sites excluding sampling site-4 (Imarti Nadi in summer) results showed good water quality as values are found below 50 in all seasons. At sampling site 4 in summer, WQI was found 81.21, which indicated the poor quality ofwater. However, the quality of the water is enhanced because of the diluting effect during the rainy season. Thus, it can be asserted that the water quality varies with the seasons and severe declines in some months (Isaac & Siddiqui, 2022). Zandagba et al. (2017) previously reported better water quality in rainy seasons than in winter and summer seasons.
These seasonal variations in WQI were potentially influenced by water physicochemical parameters (Jiang et al., 2018). In the study, Fluoride content was recorded highest (1.38 mg/l) in summer season in Jada Talab and lowest (0.10 mg/l) in Chimrani Nadi in rainy season. The pattern of fluoride levels gradually increased from rainy to summer season as recorded in all water bodies. Correlation between physic-chemical parameters and WQI is analyzed and it is shown that fluoride value has the highest linear positive correlation with WQI (r = 0.9971) at all sampling sites (Table 4). Besides this, WQI had the lowest positive correlation found with DO (r = 0.0787). Furthermore, BOD had negative correlation found with WQI (r = -0.0128). Figure 3 is showing WQI correlation with Fluoride in all seasons at all sampling sites, where Jada Talab sampling site has the highest value of WQI (140.89) with highest fluoride value (1.38). The physiochemical factors are responsible for abundant growth of Cynophycean bloom under high nutrient concentrations that can affect negative human health (Sharma et al., 2016).
CONCLUSION
The WQI of the four rain-fed water bodies in Nagaur district, Rajasthan ranged from 43.08 to 140.92. A high WQI above 75 was reported in the sampling site-1 (Jada Talab) located in city indicates poor water quality in terms of potable water. The water quality was reported better during the rainy seasons and decreases in winter and summer. The high value of WQI of this sampling site is mainly due to the ignorance of water conservation and populated catchment area. Besides this, all other village sampling sites have an excellent quality of water in all seasons except the sampling site-4 (Imarti Nadi), which has WQI above 50 in the summer season and shows poor quality of water due to exploitation of water in summer as it is not managed by any village community. Other village ponds are the best examples of conservation of water quality and ethics by village community from ancient times. Calculations for WQI show that fluoride is the most influencing parameter in the study. The determination of a water quality index is extremely valuable in assessing the quality of water as well as in water quality management. Our findings can also help decision-makers create plans for the most valued traditional water resources in western Rajasthan. It is advised that routine pond monitoring, de-weeding, and desilting should be performed on regular basis to maintain the pond’s value and protect it from possible harm.


